 Sufficient Statistics
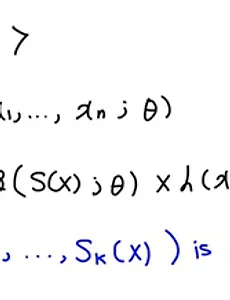
Sufficiency : T(X1, X2,..., Xn) is said to have 'sufficiency' for the parameter, if the conditional of X1, X2,...Xn given T=t does not rely on the value of the parameter. And the T(X1,X2,X3,...,Xn) is called 'Sufficient Statistics.' That is, by gaining T we need no longer to find knowledge about the parameter from random samples. Figuring out whether the conditional of X1, X2,...Xn given T=t doe..
2020. 9. 10.
Sufficient Statistics
Sufficiency : T(X1, X2,..., Xn) is said to have 'sufficiency' for the parameter, if the conditional of X1, X2,...Xn given T=t does not rely on the value of the parameter. And the T(X1,X2,X3,...,Xn) is called 'Sufficient Statistics.' That is, by gaining T we need no longer to find knowledge about the parameter from random samples. Figuring out whether the conditional of X1, X2,...Xn given T=t doe..
2020. 9. 10.


