Geometric distribution VS Negative Binomial distribution
The relationship between Geometric distribution and Negative Binomial distribution is similar to the relationship between Exponential distribution and Gamma distribution.
The random variable of a negative binomial distribution is the sum of independent and identically distributed geometric distribution.
In other words, Geometric distribution is a special case of Negative Binomial distribution when the number of success(r) equals 1.
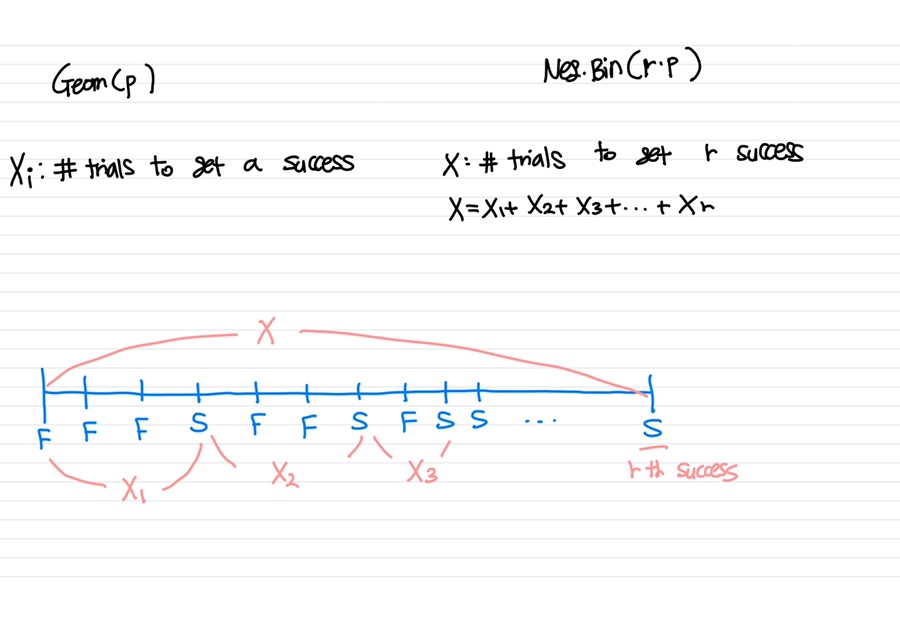
Geometric Distribution
when X follows negative binomial distribution, X~Geom(p)
X: the number of independent trials until to get a success.
p: probability to get a success
So geometric distribution is a discrete distribution because it deals with the discrete numbers

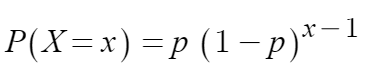
PMF(Probability Mass Function) of Geometric Distribution
Expected value and Variance of Geometric distribution

Negative Binomial Distribution
when X follows negative binomial distribution, X~Neg.Bin(r,p)
X: the number of independent trials until to get 'r'th success.
r: the number of successes in 'X' trials
p: probability to get a success
So negative binomial distribution is discrete distribution because it deals with the discrete numbers.

PMF(Probability Mass Function) of Negative Binomial Distribution

Expected value and Variance of Negative Binomial Distribution

Proof of relations using pdf, E(X) and Var(X)
Geom(p) is a special case of NB(r,p) when r(number of success) is 1.
So when substituting r in negative NB(r,p) with 1, it became geometric distribution.

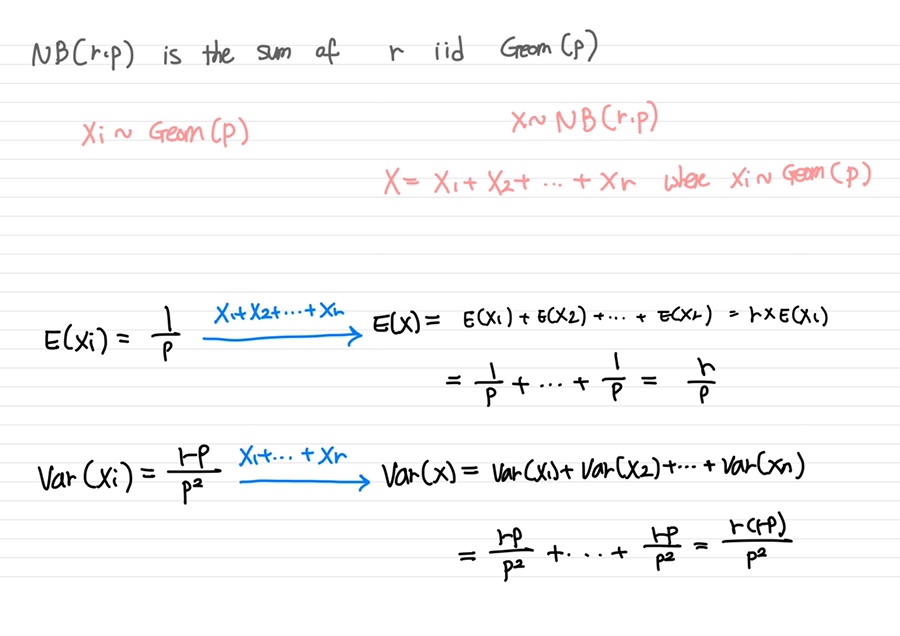
NB(r,p) is a sum of 'r' independent and identically(iid) distributed Geom(p).
So expected value of NB(r,p) is the sum of r expected value of Geom(p).
Also, the variance of NB(r,p) is the sum of r variance of Geom(p).
Proof of relations using Moment Generating Function.
This is direct proof using moment generating function. Moment generating function is unique. Moment generating function of Negative Binomial distribution looks like multiplying moment generating function of exponential distribution r times.

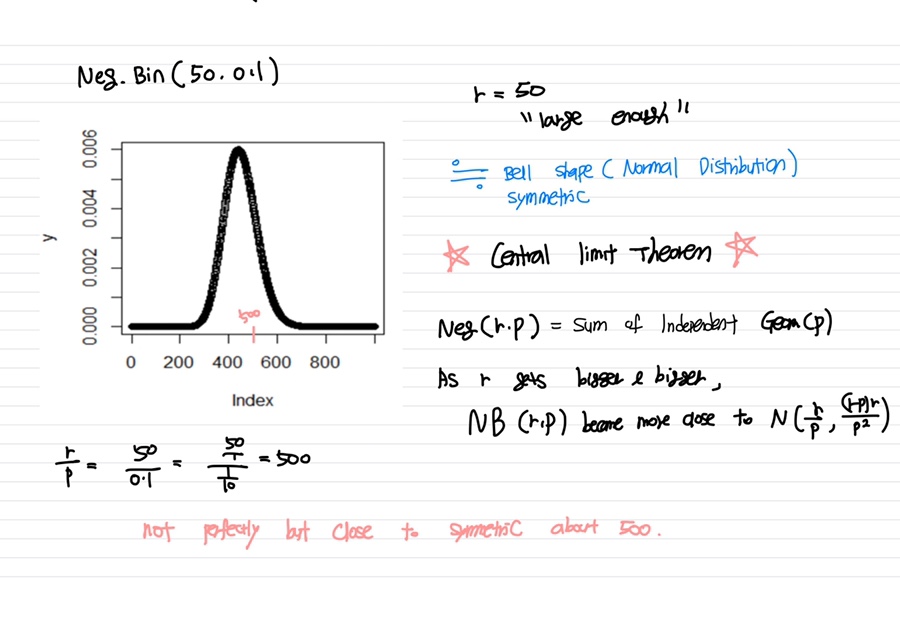
Proof of relations using Graphs (R)
The graph of NB(r,1) looks the same as Geom(p).

As NB(r,p) is sum of independent and identically distributed Geom(p), it follows central limit theorem when r is large enough. So graph of NB(r,p) when r is large enough looks symmetric with its mean as it converges to normal distribution.
'Statistics' 카테고리의 다른 글
| Relationship between Exponential and Poisson distribution 지수분포와 포아송 분포의 관계 (0) | 2020.07.14 |
|---|---|
| Memoryless Property of exponential and geometric distribution 지수분포와 기하분포의 무기억성 (0) | 2020.07.14 |
| Relationship between Exponential and Gamma distribution 지수분포 감마분포 관계 (0) | 2020.07.14 |
| Poisson approximation to Binomial distribution 이항분포의 포아송 근사 (0) | 2020.07.14 |
| Bayes Theorem 베이즈 정리 (0) | 2020.07.14 |


