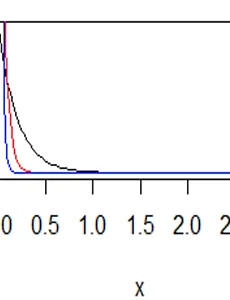
 (R)ways to draw curve (function) -curve(), ggplot()
1. exponential distribution > curve(dexp(x,rate=2),from=0,to=6) >ggplot(data.frame(x=c(0,6)),aes(x=x))+stat_function(fun=dexp,args=list(rate=2)) 2. Normal distribution > curve(dnorm(x,mean=5,sd=1),from=-10,to=10) >ggplot(data.frame(x=c(-10,10)),aes(x=x))+stat_function(fun=dnorm,args=list(mean=5,sd=1)) 3. T distribution >curve(dt(x,df=3),from=0,to=10) >ggplot(data.frame(x=c(0,10)),aes(x=x))+stat_..
2020. 8. 13.